
2. Monitoring the cluster
Node stats
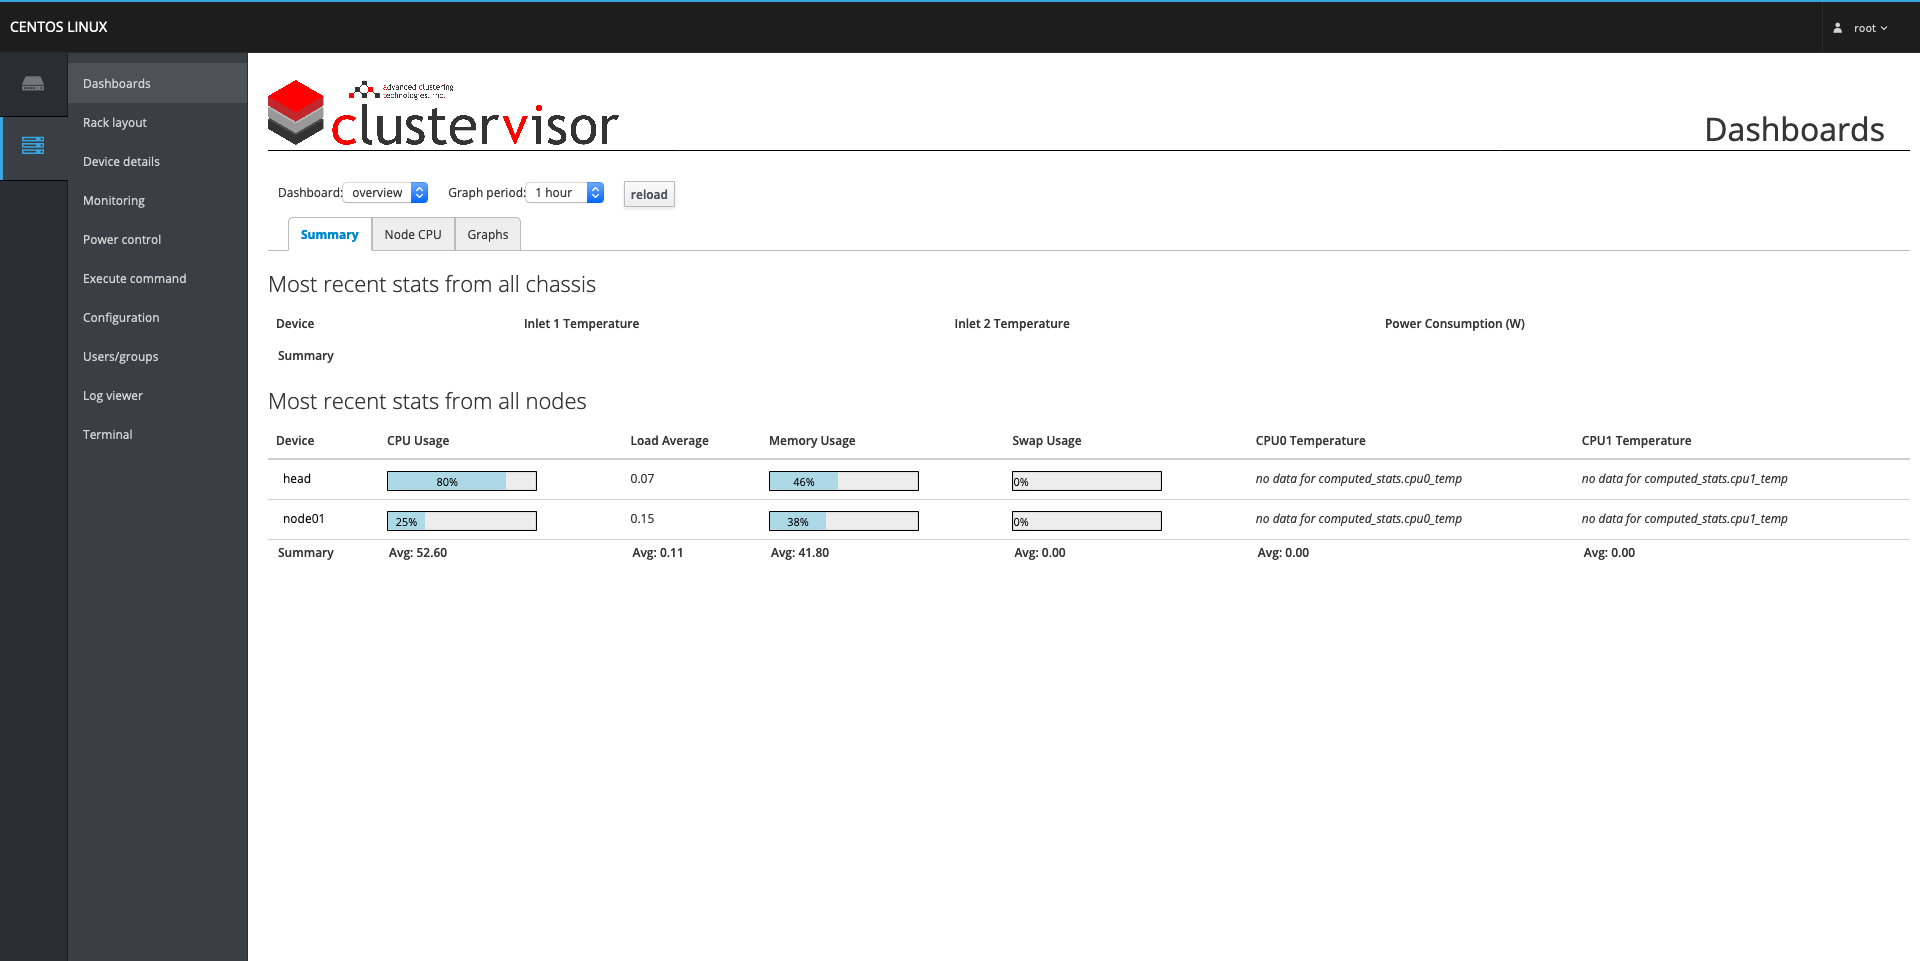
When ClusterVisor is first opened, it will display the Dashboard page that provides a way to monitor the general state of the cluster at a glance. Under the Summary tab on this page, all of the nodes in the cluster will be listed alongside their most recent stats. If any of the nodes stats have crossed a critical threshold, the node's name in the Device column will be highlighted in red to make problematic nodes easy to distinguish among the other nodes.
If a node is highlighted in red to indicate an issue has occurred, the cause can be determined by clicking on the highlighted device name. This will present a pop-up showing more details about the selected node. The first tab, Monitoring, presents the monitored stats along with indicating which one crossed its threshold under the Status column. The other tabs for monitoring the node are the following:
- Graphs - Used to display graphs of various statistics of the node over time. These statistics include CPU utilization, disk usage, and network I/O.
- All stats - This lists all of the current values of the stats that ClusterVisor collects.
The names of the stats are the ones used in the Influx database and are also names that should be used later on for creating "Monitoring Rules" to get notified about specific events (which can be done from the Configuration page under the Monitoring Rules tab, see more about this from section Configurations in ClusterVisor of this guide).
This same window is not just accessible from the Dashboard page, but can also be accessed from the Rack layout page by clicking on the names of the nodes presented or from the Device detail page by selecting the desired node from the Device drop-down menu. As well, the status of the monitored stats under the Monitoring tab mentioned earlier can be found on the Monitoring page, but will display the status for all the nodes in the cluster.
.png?inst-v=fc8db1b4-4996-49bd-8a97-181658063401)
.png?inst-v=fc8db1b4-4996-49bd-8a97-181658063401)
.png?inst-v=fc8db1b4-4996-49bd-8a97-181658063401)
Using the command line
While the graphs are exclusively available in the web interface, the stats for the nodes can be queried from the command line using cv-stats. By default, the stats of the node(s) will be listed in brackets with the node names listed below beside the value of each stat. As well, the status of the monitored stats can be queried from the command line using cv-monitoring, and is displayed by default in the same form as cv-stats.
Cluster stats
.png?inst-v=fc8db1b4-4996-49bd-8a97-181658063401)
The Summary tab on the Dashboards page will display information and graphs about the nodes. The other tabs on the page provide graphs about the cluster as a whole. The Graphs tab will show graphs about the utilization of hardware across the cluster over time, while the Node CPU tab will provide a breakdown on each node's CPU stats so they all can be viewed together on the same page.
.png?inst-v=fc8db1b4-4996-49bd-8a97-181658063401)
These are just the fields provided in ClusterVisor by default, but the Dashboards page can be customized to change the graphs that are presented and add new tabs. This can done by navigating to the Configuration page and selecting the Dashboards tab. Further explanations on how to use the Configuration page can be found under section Configurations in ClusterVisor of this guide.
Using the command line
The dashboards can be customized through the command line using cv-conf. The default dashboard can be modified by running:
$ cv-conf -e dashboard.overviewFor more information about using cv-conf, see section Configurations in ClusterVisor of this guide under its "Using the command line".